• Blog
  • About
Powered by Blogger.

Path to prosperity

Company Overview

ARA Logos Logistics Trust (ALOG) has 30 logistics properties (10 in Singapore, 20 in Australia) and stakes in two property funds. Based on its latest 1Q 2021 business update, 73% of its gross revenue is derived in Singapore while 27% is derived from Australia. Based on its FY 2020 DPU of 5.25 cents, it is trading at a 12M trailing distribution yield of 6.6%. 

ALOG's business model is like any other REIT where it collects rental income as the landlord from its tenants. Its tenants are a mix of third-party logistics players or 3PLs (eg. DHL, FedEx) and end-users like ST Engineering. After collecting rent, it would have to pay certain property expenses like property manager fees and leasing commissions. Historically, Net Property Income (NPI) margins have been hovering around 75%. After property-level expenses, we have to take out REIT-level expenses like REIT Manager fees and also remove borrowing costs to derive a net income. From this net income, non-cash items are added back to get the income available for distribution to unitholders. 

History

ALOG was listed in 2010 as Cache Logistics Trust (CACHE) with 6 properties that were master leased to its sponsor back then, CWT. Over the years, as shown in the diagram below, CACHE has acquired properties almost every year. In recent years, acquisitions have trended towards Australia to increase its exposure to freehold assets as management recognised that the declining land leases in Singapore could lead to valuation declines. 

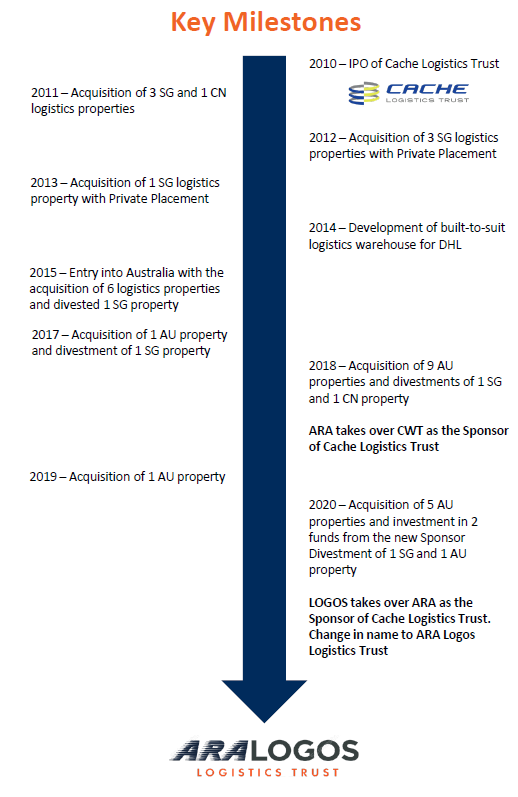
ALOG History (Data Source: Cache Logistics Trust)

In 2018, ARA took over as the sponsor of CACHE as CWT sold off its stakes in the REIT and REIT Manager. As the master leases from CWT expired, they were not renewed and this led to a decline in occupancy as master-leased properties were converted into multi-tenanted properties. Rentals were also affected as master lease rentals were above market rents at the time. 

Reducing exposure to CWT was also opportune as CWT defaulted on its loans in 2019; this was also somewhat linked to financial troubles at HNA Group, which bought over and delisted CWT in 2017. I understand that there have been no defaults on rentals by CWT and CWT only contributed 2.2% of gross rentals in 1Q 2021. 

In 2020, there was another change in sponsor as LOGOS was made the sponsor after ARA bought over LOGOS and made LOGOS its logistics arm. Ultimately, ARA is still in control here. This also led to the change in name from CACHE to ALOG. 

1. New sponsor to provide development expertise and US$11.4b acquisition pipeline

The new sponsor LOGOS has 111 assets in APAC worth US$11.4bn. This provides ALOG with an acquisition pipeline that it did not really have with ARA before. As ARA is more of a fund manager, the new development expertise that LOGOS brings could also help with asset enhancements and redevelopment. Being a logistics-focused developer also implies LOGOS would have tenant partnerships with a broader range of logistics players. 

LOGOS AUM (Source: ALOG)

I think this provides more visibility on inorganic acquisitions for ALOG. Apart from direct acquisitions, being under the LOGOS umbrella would also give ALOG an implied first look at certain fund investments. This materialised in its latest acquisition in 2020 where ALOG invested in two funds, one of which was managed by LOGOS. 

2. Future-ready assets with built-in escalations provide good organic growth visibility

In Singapore, 8 out of ALOG's 10 assets are ramp-up warehouses which tend to command a premium compared to older cargo-lift warehouses. These ramp-up warehouses support 3PL operations as it allows delivery trucks to drive up to the higher floor warehouses to load/unload goods as opposed to unloading on the first floor and taking a cargo lift to higher floors. This results in rentals of higher floors being more comparable to the first floor. 

In Australia, its leases have built-in rental escalations of 1-4% which provide very good visibility in terms of organic growth. According to JLL, rental growth is expected to outpace inflation over the next 10 years allowing logistics real estate to deliver real (inflation-adjusted) growth. 
Australia logistics rental

3. Attractive yield spread over alternatives and historical mean

ALOG also has an attractive yield spread of at least 230bps over investment alternatives. While some of it is due to the liquidity premium (vs MLT) or issuer risk (vs CPF SA/MAS10Y), I think that the yield spread should be much smaller, maybe 100-150bps instead. In my opinion, the compression in yield spread should be a result of the stronger growth potential due to its smaller base compared to MLT and 0 growth compared to CPF SA/MAS10Y. 
Yield spread comparison

Compared to its own historical trading yield, ALOG is also trading at >+1SD above its historical mean. I think it should actually be around the -1 SD level instead as it currently has a better growth outlook from its new sponsor. Additionally, in 2019, there were concerns over its exposure to CWT as CWT had just defaulted on a loan. 
ALOG forward trading yield (Source: UOBKH)

Potential concerns

Trading at 6.6%, ALOG may find it difficult to make DPU accretive acquisitions as cap rates continue to compress especially in Australia. This difficulty materialised in its latest acquisition at end-2020 when it made a DPU dilutive acquisition of 5 properties and fund investments. The messaging from ALOG was that it was 'biting the bullet' this once in order to reset its growth trajectory. Without this, it would have been stuck in a vicious cycle of not being able to acquire and grow. Thus far, investors have given them the benefit of doubt and share price has improved since the announcement. 

Another concern would be the declining land leases of its Singapore assets. ALOG has 2 assets that have <15 years left on their land leases. Gul Logiscentre has 12 years left and contributes about 2% of revenue. I think ALOG could divest this asset and recycle the capital into freehold assets abroad. As for Commodity Hub which has 14 years left, ALOG is likely to hold on as it is their 'crown jewel' contributing 22% of revenue and being one of the largest warehouses in SE Asia. Due to its specifications, I think JTC is likely to renew its lease when the expiry comes. 

FYI I'm not vested in ALOG. 

Share
Tweet
Pin
Share
1 comments

With the announcement of LREIT's results a few weeks back, all retail REITs with exposure to SG retail have announced their results. Similar to the previous article, the focus will be broadly on the performance and outlook for these REITs and I will highlight some catalysts to look out for. Didn't have the time to write FCT, so will leave that out for now. 

Lendlease REIT (LREIT)

Lendlease REIT reported year-on-year increases in financial metrics like Revenue, NPI and Distributable Income however I think these are quite difficult to analyze as the 1HFY20 figure was annualized and pro-rated since LREIT only listed halfway through that half. Focusing on operational performance would be more valuable. About 60% of its NPI for the half-year was from 313 Somerset and this is its only asset in Singapore. The other asset is an office property in Milan that is master leased so there would not be much variations to explain. 

Occupancy remained high at 98.7% at 313 despite the Covid-19 pandemic. With the phase 3 reopening, 313 reported a 19.5% qoq improvement in tenant sales and a 12.4% improvement in footfall. This represents 75/60% of pre-Covid levels respectively. This trend was similar across other REITs where tenant sales have improved more than footfall. I think this could be due to deliveries for sub-urban malls and also larger ticket sizes from Singaporeans as borders remain closed. 

LREIT highlighted that it is focused on maintaining occupancy levels and help tenants stay viable; my read through for this is that there could be rental abatements or reliefs given and reversions could be less positive than before. Nonetheless, some (albeit lower) income is better than no income. 

A key catalyst for LREIT is definitely more acquisitions; currently, it only has 2 fully-owned properties and a small stake in ARIF3 (which owns JEM). The Sponsor has cleverly structured the REIT to be global and commercial such that the range of potential acquisitions is quite wide. In the near-term I expect there to be acquisitions from the sponsor overseas and a gradual increase in the stake in ARIF3 and perhaps even new stakes in PPP (Parkway Parade) and PLQ. 

SPH REIT

SPHREIT was the first to report its results in mid-Jan and is largely underpinned by Paragon (74% of revenue). Paragon suffered a 12.9% decline in revenue while Clementi Mall declined less at 6.6%. This is understandable as prime retail malls (especially luxury ones like Paragon) would suffer more from the dearth of tourists. Clementi Mall, as a suburban mall beside Clementi MRT, would have been less impacted as office workers work from home and patronize their nearby mall. 
Year-on-Year Footfall and Tenant Sales trends (Source: SPHREIT)

Looking at the graphic from SPHREIT's presentation, tenant sales held up very well at Clementi Mall while Paragon still remained resilient. Footfall for Paragon actually held up more than Clementi Mall. A few possible reasons for this. 
i) Clementi Mall was affected by capacity restrictions. For those who have been to Clementi Mall pre-Covid, you would remember how packed the place used to be. There was barely enough space to walk more than 5 steps in a straight line. Safe distancing measures could have limited the number of people allowed inside the various shops. 
ii) The affluent are less impacted by Covid-19. Those buying luxury goods at Paragon's high-end shops like Balenciaga and Prada would probably continue buying during the pandemic due to their high level of financial resources. Luxury items also hold their value well. 

In terms of catalysts, investors can look out for:
a) recovery from Covid-19 and opening of borders 
b) acquisition of assets from the sponsor, in particular Seletar Mall, which has been talked about for the longest time

Starhill Global REIT (SGREIT)

SGREIT continued to retain income as it only distributed 0.14 Scts out of the 0.35 Scts it retained. This could be an indication of where it sees the recovery of retail. I think the REIT could be worried about its exposure in Malaysia (13.4% of NPI) as the country remains in lockdown and also the lack of tourists in Singapore for its prime retail malls (Ngee Ann City and Wisma Atria). Of note would be the Re-Align Framework where qualifying tenants can renegotiate or terminate their leases without penalties. 

In terms of capital management, apart from issuing $100m of perpetuals at 3.85%, SGREIT managed to refinance $500m of debts and also had a DRP programme in place. This means investors should take their 35.8% gearing with a pinch of salt since it does not include perpetuals and also investors need to account for the small dilution from DRP in future quarters. 

An upcoming acquisition to look out for is the acquisition of Isetan's stake of Wisma Atria. This could have been the reason why SGREIT raised perps. However we understand that the yields for retail malls are still low (4-5%) and hence it may be challenging for SGREIT to acquire the property accretively. Furthermore, the remaining lease on Wisma is only 40yrs. 
Share
Tweet
Pin
Share
No comments

Over the past few weeks, S-REITs have been announcing their results for the quarter ended 31 Dec 2020. Out of the few sectors (Retail, Office, Industrial and Hospitality), REITs with exposure to the Singapore office market have finished announcing their results. The article will broadly summarize what the key takeaways have been for me and also highlight some of the catalysts that investors in such REITs can look out for. Most of these REITs have non-SG Office exposure too but the focus will be on SG Office since that is the key exposure (apart from CICT). 

Suntec REIT

In previous years, SUN had a significant portion of distribution that was capital in nature; this was absent in FY20. However, it seems like there was guidance from management during the briefing that such capital distributions could be used to keep DPU stable in FY21 as SUN recovers from the retail and conventions (~13% of NPI) fall out. 

Most of the decline in portfolio valuation (-1.8%) was driven by the mall and convention space. Suntec City office, ORQ and MBFC declined by 1.2/0.6/0.8% respectively. Not too worrying as I think valuers imputed weaker reversions in the near term. 

On the office front, SUN guided that there would be continued pressure on rents as companies turn cost-conscious. The pace of renewals was also expected to slow as downsizing was expected. Only about 20-30% of the workforce has returned to their offices. Nonetheless, SUN expects positive rental reversions to continue especially driven by the UBS lease at ORQ which seems to have been done at <$8.50 according to JPMorgan. This can explain the divergence in occupancies and rents seen in the chart below. Typically we would have expected higher occupancies and lower rents as landlords try to fill up their space in a downturn. 

As for growth and catalysts, 2021 would see the absence of rental reliefs and full contribution from:

  • 21 Harris Sydney acquired in Apr 20
  • 477 Collins St Melbourne completed in Aug 20
  • Nova Properties UK acquired in Dec 20
  • 9 Penang Rd Singapore
On the flipside, DPU is expected to be impacted by negative reversions at its mall and convention centre and overhang from its high gearing of 44.3% and low ICR of 2.6x (in 2022 REITs would need ICR of >2.5x to have a gearing of >45%). Analysts are forecasting a DPU yield of around 5.3-5.8% on the back of ~10-15% growth for FY21. 

Suntec City Office Committed Occupancy and Passing Rents (Source: Suntec REIT)

Keppel REIT

KREIT had a 2.7% yoy improvement in DPU due to contributions from T Tower and Victoria Police Centre but offset by rental reliefs and divestment of Bugis Junction Towers. Looking ahead, analysts expect DPU yield to be around 5.0% DPU growth will be driven by:
  • Victoria Police Centre (2H20 onwards)
  • Pinnacle Office Park (Dec 20 onwards)
  • Keppel Bay Tower (2Q 21 onwards)
KREIT highlighted that most of its new leasing was from Banking & Finance (36.5%) and Real Estate (34.2%) which doesn't seem entirely in line with news reports of tech companies being the largest new demand sector. The TMT sector contributed 13.5% to KREIT's new leasing demand but 34% to Suntec's new leasing demand. So maybe OFC just doesn't attract tech as much as Suntec City office if we ignore the overseas assets. Nonetheless, management continues to expect positive rental reversions as expiring rents ($9.76 in 2021 and $10.26 in 2022) are still lower than new signing rents ($11.02). 

Valuations declined by 1.6/1.8/1.1% for OFC, MBFC and ORQ respectively. Diving into the numbers, I am intrigued by the MBFC and ORQ ones as the declines are more than that of what Suntec experienced for their stake in MBFC and ORQ. Putting them beside one another so that readers can compare. Not sure if I missed anything important that could explain this difference. 
Suntec Valuations (Source: Suntec REIT)

KREIT Valuations (Source: Keppel REIT)

During the briefing, management guided that it was continuing to look for acquisitions in Australia and Korea and could scale back unit buybacks to conserve capital. It seems there is also potential for KREIT to partner with its Sponsor to redevelop Keppel Towers. Not very sure if gearing of 39.0% (post acquisition of Keppel Bay Towers) is a concern considering KREIT also has pseudo-debt in the form of perpetual which could increase debt by 10% so maybe around 43% gearing if we include it. 

OUE Commercial REIT

OUECT is the only one in the office REIT space that continues to have a retention of distributable income. 11m of distributable income was retained, 6m of which was for working capital for their hospitality segment. This is understandable as hospitality continues to be badly hit and they are also looking at closing Mandarin Orchard for a rebranding to Hilton. 

Like Suntec and KREIT, OUECT experienced positive rental reversions for its SG office spaces and expects such positive reversions to continue albeit at a slower pace as committed rents were still above expiring rents. Management highlighted that there could be transitional vacancies as leases expire but overall should still be fairly stable. The largest tenant, Bank of America also recently renewed their lease at OUE Bayfront and would remove an overhang. 

Following the divestment of 50% of OUE Bayfront, DPU could be weaker yoy due to the income vacuum. There would also be lower hospitality revenue once MOS is shut for rebranding. Based on disclosures, it seems like the proceeds from divestment could be used to pay down debt (41.2% now but 34.5% if paid down) or distributed to unitholders. To me this is not positive as it indicates a lack of capital recycling opportunities from the REIT and also not conducive for DPU. It is giving up 3.6% yield (using cap rate as a proxy for yield) to save on 3.0% cost of debt resulting in a net loss of 0.6% income on the capital. OUECT already doesn't have the best reputation due to its dilutive fund raising a few years back and also Sponsor that is linked to the Riady family that has backed First REIT and LMIRT. 

I think it will continue to trade at a discount to its peers due to i) reputation of sponsor and ii) exposure to hospitality. On a trailing 12M basis, it trades at around 6.2% yield, while its peers are trading at sub 6% yields. 

CICT

Finally, the to the largest REIT in Singapore, CICT. Took >2hrs to read through the slides and listen to the webcast. Since the work has already been done, I will also touch on retail a little. 

For Office, leasing momentum has picked up over the past few quarters as tenants have a clearer picture of what a post-Covid-19 world will look like. 86% of new demand was from financial services. This also underscores the idea that financial services will still demand high quality offices more than tech firms which can go to business parks or city fringe. 

Looking at the graph below from CICT, we can tell that market rents have passed their peak in late 2019 and are gradually going on a downtrend. While I do not expect the trough of rents to fall below $9.00 psf, I think the decline will be long drawn as office landlords are still reporting positive reversions from lower base rents entered into during the upcycle. 
Market Rents across time (Source: CICT)

On retail there were a few key concerns by analysts. 1) Is the worst over? 2) Tourism impact for tenant sales 3) Reversions and 4) New retail. It appears that the worst is over and we would not go back to 2Q2020. Tourists used to account for maybe about 20%+ of tenant sales for downtown malls. Reversions would still be negative going forward to support tenants and ensure that there is a good mix of tenants conducive for shoppers. 

For DPU growth, it would be driven by the completion of:
  • CapitaSpring (2H21)
  • Lot One AEI (2H21)
  • 21 Collyer Quay (4Q21)
  • 6 Battery Road (4Q21)
This could be offset by additional AEIs that the REIT Manager undertakes during the year as well as divestments. From the sound of it, I'm not sure if JCube could be divested as it seems like it doesn't really have a strong value proposition when trying to compete against JEM and Westgate which are attached to the MRT and have everything. 

Summary

Overall I think that office REITs' growth has to be driven by inorganic growth as there is little room for organic growth. Organic growth will be held back by tenants giving up space and negotiating shorter leases. On the flip side, shorter leases could be positive if the cycle bottoms out soon as that would give landlords more negotiating power if leases end on an upcycle. From a tenant perspective, it really doesn't make sense to be leasing the same amount of space when you only can have a maximum of 50% of your workforce back. I think the shift will be to co-working concepts that allow companies to do a core+flex strategy to optimize rental costs. With greater prevalence of co-working, that could also imply lower rents for landlords since co-working operators take up large volumes of space. 

As most office REITs have gearing of >40% (KREIT is 39%), there is also a small 'risk' of equity fund raising to bring this down. I think what could be prudent for REITs to do is to do a fund raising together with an acquisition and 'over-raise' a bit to bring down gearing. So on a net basis the acquisition is less accretive than it could have been but still accretive to DPU. 
Share
Tweet
Pin
Share
2 comments

The airline industry has been one of the most badly hit by the Covid-19 pandemic as international air travel ground to a halt. Even as there are green shoots of recovery in the economy and green lanes are opening up, air travel is still >90% down from pre-Covid levels. In light of this, investors have been reconsidering their stakes in the industry. I recently read an article about the recovery in the airline industry being unequal and would like to give my take on the points mentioned. Generally, it argued that the characteristics of low-cost carriers ('LCCs') would allow it to recover faster than full-service carriers. 

1. LCCs serve point-to-point destinations

Direct flights reduce the number of points of contact during travel and could give passengers greater peace of mind when travelling. We have seen pictures and videos circulating around of passengers in full PPE suits in airports and this further highlights the concerns passengers have about being locked up with strangers in a flying metal box for a few hours. LCC typically serve direct flights vs full-service carriers like SIA, which operate more of a hub and spoke model. 
Passengers at Changi Airport ready with PPE

2. LCCs operate regional flights 

Operating regional flights could be a plus in this case as passengers would want to reduce the time spent in an aeroplane. Such flights are closer and are within the tolerable risk perception of travellers. Additionally, the recession brought about by Covid-19 could lead households to tighten purse strings and opt for regional destinations. LCCs that operate in countries with domestic travel should start to see shoots of recovery with governments pushing hard to boost domestic tourism. 

3. LCCs serve leisure travellers

The profile of passengers for LCCs tends to be leisure travellers as their price-sensitive nature is met with competitive prices from LCCs. On this front, I'm not sure if this is positive or negative for LCCs. On one hand, corporate travel is likely to be cut back with weakening profitability whereas leisure travel is always likely to be around due to an intrinsic nature to explore new places. On the flip side, corporate travel is many times more likely to be classified as 'essential travel' that can restart sooner. 

Additional points of consideration would be survivability. Full-service carriers with strong backing from governments should have much better support during these times and are less likely to fall into financial ruin. This is evidenced by SIA's S$8.8bn rights issue supported by Temasek. The longer the pandemic drags on, the less likely non-government-backed LCCs can survive. 
Share
Tweet
Pin
Share
No comments

As the world experiences an uneven recovery from the Covid-19 virus, investors continued to pile into markets driving the S&P and NASDAQ indices to all-time highs. The divergence between reality and stock markets have been explained by some as the lack of any viable alternatives for return as interest rates have plummeted. 

On the S-REITs front, industrial REITs have continued their outperformance while hospitality and retail continue to lag. In this article, I will explore some general concerns investors have regarding REITs in order to provide readers with more tools to evaluate REITs. 

1. Have equity valuations fully accounted for real estate valuations?

In my opinion, the short answer is 'No' as most valuations would have been done at the last year-end, generally being Dec 2019. In Dec 2019, Covid-19 was still in its nascent stages and valuers were unlikely to have factored in the profound changes that the pandemic has brought about. As cashflow and growth are inputs of certain valuation methods, I think the decline in both would lead to lower valuations when assets get revalued soon. 

An example of this valuation decline from book value would be OUE Limited's sale of US Bank Tower for US$430m vs its book value of US$650m (~1/3 lower!). Additionally, I do believe that asset owners are holding back on conducting asset revaluations as this could have a negative impact on loan covenants (Ie. fall in asset value leading to higher LTVs). 

2. Could leverage limits be breached?

Leading on from my previous point, this is certainly true as valuations decline. The key concern about breaching leverage limits would be the implications on capital structure. If a REIT is close to breaching the limits, it is more likely to embark on equity fundraising (possibly dilutive). This could be why we are seeing smaller premiums (or larger discounts) attributed to REITs with >40% gearing like ESR REIT and ARA Logos Trust. From a pure property investment standpoint, a 40% LTV is not actually something to be very worried about as private funds do not have such limits and tend to go over 50% LTV. However, being a REIT comes with this trade-off of extra regulations. 

For investors with a longer memory, S-REITs undertook extremely dilutive equity fundraisings during the GFC period headlined by blue-chip names like Mapletree Logistics Trust and Capitaland Commercial Trust. That exercise caused a crash in REIT stock prices; the crash was a short-term one and REITs subsequently had a strong run until 2019. 

3. When will things go back to normal?

Due to the difficulty in quickly testing for Covid-19, I believe that a return to the old norm will come only when a fast test and a vaccine are found. As earlier mentioned, different REIT subsectors have had different impacts from Covid-19. Subsectors like data centres and logistics are strong beneficiaries from the shift to a virtual economy and stay-at-home nature that comes with Covid-19. Others like hotels have been decimated while the future of retail and office are still up in the air. 

For both office and retail, I believe that the longer the pandemic lasts, the more people would be accustomed to flexible working and online shopping respectively. Covid-19 has accelerated nascent trends and this may not be reversible. On the flip side, we have also been seeing office workers pining to return to office as work-from-home arrangements have caused additional stress. Shoppers have also been craving the full sensory engagement that comes with seeing and touching items. 

As for hospitality, while it is a short term mega loser, I do think that in the long run, it will recover more than office and retail, especially leisure travel. Corporate travel could be somewhat hampered by greater adoption of virtual conferencing but leisure travel is something I believe society is itching to go back to. Of the top 5 oldest business that have been around since before 1300, 4 of them are hotels. This further emphasizes the intrinsic need that humans have for exploration and discovery. 

Conclusion

While the market continues to power on, I do think that the Covid-19 situation has shown the importance of having a strong balance sheet and survivability. These are characteristics that are present in most REITs as they have strict gearing limits and have cashflows backed by assets.  When the time comes, I believe REITs will come back in favour. 
Share
Tweet
Pin
Share
No comments

PropNex released its 1H20 financial results and reported a 151% surge in net profit after tax to $16.0m. According to PropNex the key driver of earnings growth was the project marketing services segment, which had revenue growth of $75.1m vs total revenue growth of $75.2m. As this is a higher margin segment relative to the resale market, there was an increase in gross profit margin to 11.4% in 1H20 vs 9.8% in 1H19. 

PropNex 1H20 Results (Source: PropNex)

In previous quarters, PropNex mentioned that transactions usually would have a 1-2 quarter delay from the time the agreements are signed until the time PropNex is actually able to recognize revenue. Hence, we can deduce that the strong showing in 1H20 can be attributed to the stronger 2H19 in property sales. 

Due to Covid-19 and the ensuing Circuit Breaker in Singapore, 2Q20 sales volume was strongly affected as there was a 37.6% qoq decline in private residential properties sold from 4,269 to 2,664. I believe that this would negatively impact 3Q and 4Q results and do not rule out a >20% decline in net profit in the coming quarters. 

Outlook

PropNex believes that despite the headwinds brought about by weaker economic growth, demand in the property market can continue to be resilient due to a few factors
  1. Lower interest rates to reduce the cost of buying properties with a mortgage
  2. Developers adjusting their prices to more competitive levels
  3. The weaker economic environment could help keep prices stable
PropNex also estimates that there could be 8,000-8,5000 new home sales in 2020 with a total of 14,500-15,500 total units (including resale) vs 19,150 in 2019. On the HDB front, PropNex forecasts HDB resale volume to be between 20,000 to 22,000 for FY20 vs 23,714 in 2019. The softer decline in HDB volumes reflects the relative affordability of public housing and also the large chunk of flats reaching their MOP in 2019/2020. 

Takeaways

While I agree that lower interest rates make it conducive for buyers, it also increases the holding power of sellers who may not have adjusted down their selling price expectations. Therefore, transaction volumes may continue to remain low. The generous support provided by the government to businesses and individuals also helps to alleviate some of the financial pressures facing homeowners, in turn, lowering any urgent need for liquidity. 'Desperate' sellers could be HDB upgraders who have to sell their property. 

On the topic of HDB upgraders, it was initially expected that 2020 would see a bumper crop of them due to the large number of HDB flats reaching their 5-year MOP. However, in light of the pandemic and uncertainties, I believe that a number of upgraders could have held back their upgrading plans until their job outlook becomes more certain. Assuming timelines are pushed back by 1 year, this could also result in 2021 having a super crop of 5-7 year-old HDBs being on the resale market. With completions of the latest BTO launch expected to be in 2025-2027, anxious homebuyers could turn to the resale market instead. 

Another area to look out for is potential fire sales from developers racing to beat the ABSD deadline. In Jun 2020, we saw an instance of this (https://www.businesstimes.com.sg/real-estate/to-beat-absd-38-jervois-developer-launches-fire-sale-to-clear-units) when the developer of 38 Jervois slashed prices by up to $500,000 (13-24% discount) to avoid the ABSD. Unless absolutely necessary I believe that developers will try to hold on to their prices as major price cuts could result in options not being exercised, angry buyers who bought earlier or even impairments. 
Share
Tweet
Pin
Share
No comments

Ascendas REIT announced their results about 2 weeks ago and reported a 3.7% growth in distributable income but a 10.8% yoy decline in 1H20 DPU. Broadly speaking results were seen as positive despite the Covid-19 pandemic raging on in other sectors. Positive rental reversions, especially in business parks, were encouraging and gearing of 36.1% continues to provide AREIT with a healthy debt headroom for acquisitions. In this article, I would like to focus on key points brought up during the analyst briefing that investors may have missed if they merely looked at the announcements on SGX.

AREIT 1H20 results highlights (Source: AREIT)

1. Positive reversions in the face of weakening outlook not weird at all

At first glance, it seems weird that AREIT could report +4.0% positive rental reversions in Singapore and +4.3% for the total portfolio despite the weakening outlook. However, management has revealed that a number of these discussions had already started taking place before Covid-19 hit and that properties were also under-rented relative to market. The positive reversions represent a mark-to-market of expiring rents rather than an actual growth in market rents. 

In particular, the management highlighted business parks as a bright spot with multiple instances of 20%+ reversions. The specific example given was that of an international bank renewing its lease at Changi Business Park for >20% reversion on a new 3-year lease for the same space (no reduction or expansion in space). CEO also highlighted that this was a positive read-through for the business park segment. 

For the rest of FY20, the management has guided for mildly positive rental reversions but cautioned that this was not indicative of the direction that the market was moving in. A better gauge could be looking at occupancies instead. 

AREIT rental reversions (Source: AREIT)

2. Logistics demand more transient in nature

Much has been said of the new-found stability and strength of logistics tenants that support e-commerce and Covid-19 related stockpiling. However, during the analyst briefing, AREIT did not believe that those 2 would drive the logistics sector much higher. 

Firstly, Covid-19 related stockpiling appears to be done on leases <1 year. Therefore, should the pandemic subside, landlords could see a decline in demand for such spaces. In the short term, we can probably see an improvement in rents from such short leases as they tend to be higher than leases with longer commitments. Such short leases also did not really have an impact on rental reversions as reversions only account for renewal leases >12 months. 

Next, while e-commerce has been doing well, it does not make up the bulk of leasing demand for logistics spaces. Instead, AREIT CEO mentioned multiple times that logistics demand in Singapore is driven by contract manufacturing and ~80% of it serves international markets. Therefore, the key catalyst for logistics would be whether Singapore can continue to attract contract manufacturers here and if product demand remains at current levels. 

Generally, excluding the transient demand from Covid stockpiling, the management said that the new take up is weaker and occupancy could trend down in the near future. 

3. Acquisitions and AEIs, while delayed, continue to be on the cards

It should come as no surprise that AREIT is reporting delays in the estimated completion dates for its AEIs and redevelopments due to the outbreak at the foreign worker dormitories. Nonetheless, asset enhancement plans continue to be on track and AREIT also announced 3 new AEIs (2 in Australia 1 in Singapore). 

There were also questions on potential acquisitions from the sponsor in Singapore and also overseas. Due to the sensitive nature of such transactions, management could only give very broad motherhood statements; they continue to be interested and have conversations with the sponsor and are doing what they can to unlock opportunities. Deals are coming back and it seems like we may see an overseas one before anything local; anyway, AREIT already did 25% of Galaxis earlier this year.

In terms of strategy, AREIT maintains that it would focus on sectors that drive economic growth like tech and bio-med. In the UK they continue to like logistics and business parks. They also continue to monitor opportunities in data centres. AREIT has a sizeable exposure to data centres from an absolute GFA perspective, however it does not pop out as much due to AREIT's size. Singtel (one of their top 10 tenants) leases data centre space from AREIT. From a pricing standpoint, the management highlighted that lower interest costs also improved the holding power of sellers and hence AREIT is not really seeing any 'Covid-pricing' yet. 

AREIT AEIs in progress (Source: AREIT)

4. DPU decline despite no retention and outlook

One analyst asked about a decline in DPU to around 3.6cts per qtr vs 4.0cts per quarter in 2019. This appeared odd given that AREIT did not retain any income and that the US acquisition in 2019 was supposed to be DPU accretive (+0.7%). To this question, the management highlighted that there were certain one-off distributions in 2019 like the rollover adjustment that contributed to about 0.25cts of distribution. 2020 results also had to account for rental reliefs given to tenants due to Covid-19 and also declines in occupancies leading to lower operational results. 

Looking ahead, one area that AREIT is poised to reap some savings is on interest cost. AREIT has some perps coming up on their reset date and whichever option it chooses to take (reset, refinance, issue bonds), AREIT is confident that there will be interest cost savings. Apart from this, most of the outlook really depends on how the Covid-19 virus progresses. 

In comparison to its Capitaland peers, AREIT has outperformed and even hit above $3.50 last week. Due to this, and the fall-off of CMT, AREIT remains the largest and most liquid REIT in Singapore. Trading at ~1.6x P/B and 4.3% FY20F yield, AREIT is in a good position to continue its growth via acquisition strategy. On the flip side, its size also means that acquisitions won't really move the needle much and AREIT does have to make portfolio-size acquisitions to continue its growth trajectory. 

Share
Tweet
Pin
Share
No comments
Older Posts

Popular Posts

  • MSCI Singapore Index rebalancing impact on stocks
  • ARA Logos Logistics Trust: 3 reasons to drive a re-rating of this laggard
  • Why Ascott Residence Trust remains the go-to hospitality gem

Tags

  • Centurion Corp
  • Consumer
  • Covid-19
  • Coworking
  • Eagle Hospitality Trust
  • Gloves
  • Healthcare
  • Index
  • Property
  • REITs
  • Sembcorp
  • SPH REIT
  • Supermarket

Blog Archive

  • ▼  2021 (3)
    • ▼  6 Jun - 13 Jun (1)
      • ARA Logos Logistics Trust: 3 reasons to drive a re...
    • ►  21 Feb - 28 Feb (1)
    • ►  24 Jan - 31 Jan (1)
  • ►  2020 (43)
    • ►  30 Aug - 6 Sep (1)
    • ►  23 Aug - 30 Aug (1)
    • ►  9 Aug - 16 Aug (1)
    • ►  2 Aug - 9 Aug (2)
    • ►  26 Jul - 2 Aug (2)
    • ►  19 Jul - 26 Jul (2)
    • ►  12 Jul - 19 Jul (2)
    • ►  28 Jun - 5 Jul (2)
    • ►  21 Jun - 28 Jun (2)
    • ►  14 Jun - 21 Jun (2)
    • ►  7 Jun - 14 Jun (2)
    • ►  31 May - 7 Jun (1)
    • ►  24 May - 31 May (3)
    • ►  17 May - 24 May (1)
    • ►  10 May - 17 May (3)
    • ►  3 May - 10 May (2)
    • ►  26 Apr - 3 May (3)
    • ►  19 Apr - 26 Apr (1)
    • ►  12 Apr - 19 Apr (2)
    • ►  5 Apr - 12 Apr (2)
    • ►  29 Mar - 5 Apr (2)
    • ►  22 Mar - 29 Mar (2)
    • ►  15 Mar - 22 Mar (2)

Created with by ThemeXpose