• Blog
  • About
Powered by Blogger.

Path to prosperity

Frasers Centrepoint Trust (‘FCT’) is a REIT that owns and operates 7 suburban malls in Singapore. FCT generates rental income from its malls that have a total of 1.4m sqft of net lettable area. The REIT is sponsored by Frasers Property Limited, which develops and manages a wide range of properties globally. While its share price has somewhat recovered, I think there is room for more premium than what the market currently accords to it. FCT continues to offer investors good value due to:

1. Visible pipeline for acquisition growth

FCT currently holds a 25% stake in PGIM ARF fund, which has 5 suburban malls with a total of ~1.0m sqft of retail space under the AsiaMalls brand. Its parent, Frasers Property (‘FPL’), holds 65% while the remainder is held by third parties. As part of a possible capital recycling strategy by FPL, the 65% stake could be divested to FCT given that the characteristics (type of malls and tenant mix) of the PGIM ARF assets are very similar to the type of malls FCT currently holds.

 Apart from acquisitions of stakes in the PGIM ARF fund, there is also the potential for FCT to increase its stake in Waterway Point, in which it currently holds 40%. The stake in Waterway Point was acquired in 2019 and this could go up once the mall stabilizes; Waterway Point is currently still within its first 2-3 renewal cycles which tend to be periods of stabilization in terms of tenant mix and footfall. Similarly, FCT could also acquire Northpoint City South Wing; FCT currently owns Northpoint City North Wing. Northpoint was reopened in 2017 after extensive asset enhancement works and is also yet to fully stabilize according to FCT. 

2. Dominant malls in regions with low floorspace per capita in Singapore

FCT’s 2 biggest revenue contributors, Causeway Point and Northpoint City North Wing, have dominant positions in the Northern part of Singapore. The Northern part of Singapore is also the region which has the lowest shopping mall floor space per capita according to a Cistri report in Aug 2019. This implies that both malls have an excellent catchment of residents and have less competition compared to other regions.

Floor space per capita (Source: Cistri)

3. Suburban retail to remain resilient amidst Covid

Suburban retail malls differ from their prime district counterparts in terms of tenant mix, with a higher proportion of tenants being in essential goods and services (ie. Supermarkets and F&B outlets). In the latest retail sales figures released by Singstat, Supermarkets and Convenience Stores were the only 2 categories that registered yoy and mom growth.

FCT is well-exposed to these sectors as shown in its portfolio trade mix where about 50% of its gross rental income is derived from F&B, Household and Supermarket tenants. The coming Covid-19 induced recession also plays to the value proposition of suburban malls, which is to have products that have accessible pricing relative to prime district malls. With consumers tightening their purse-strings, the search for value items could divert spending towards suburban malls.

FCT portfolio trade mix (Source: FCT)

Key risks 

1)     Business impact from Covid-19. An extended virus scare could negatively impact FCT’s tenants and could potentially lead to negative rental reversions and lower occupancy going forward. This could also negatively impact property valuations and cause P/B to rise in subsequent years. 

2)     Concentration risk. FCT’s top 2 malls, Causeway Point and Northpoint, contribute 75% of its Net Property Income. Any decline in population in the Northern part of Singapore or new malls built in the area could negatively impact footfall in the 2 malls.

3)     Large tenant non-renewals. About 14% of FCT’s total gross rental income is up for renewal in FY20 and non-renewals, especially for anchor tenants, could imply a period of reduced rent even if a replacement tenant is found due to the time required for fitout works. 


Share
Tweet
Pin
Share
No comments
Earlier this morning, Mapletree Industrial Trust (MINT) announced the acquisition of 60% stake in a portfolio of 14 data centres in the United States. Pre-acquisition, MINT held a 40% stake it acquired in 2017 together with its parent, which acquired 60%. Post-acquisition, MINT will own 100% of the portfolio and its exposure to the US will increase to 32.5%; data centres will now make up 39% of its portfolio. 

MINT Portfolio Breakdown (Source: MINT)

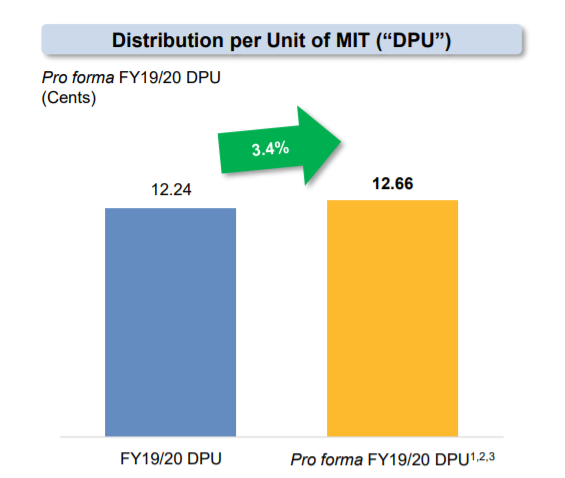
The portfolio is an extension of what it already has and improves the stability of MINT's income with a long WALE of 4.6 years, occupancy of 97.4% and less than 20% of leases expiring in the next 3 years. I think this plays very nicely into the whole data infrastructure trend that Covid-19 has accelerated. Importantly for shareholders, the acquisition is DPU accretive by 3.4% on a pro-forma basis. While minority shareholders could have their % stakes diluted somewhat by the placement, I think that this is largely irrelevant as DPU continues to grow and individual shareholders really don't own that much %-wise. 
MINT DPU Accretion (Source: MINT)

The S$299m acquisition will be fully funded by a placement exercise which aims to raise at least S$350m with an upsize option for another S$50m. The issue price range of S$2.732 and S$2.800 implies a 5.0-2.6% discount to its VWAP (volume-weighted average price) of S$2.8745. 

It has a forward trading yield of 4.3% which explains why it was able to make a fully equity funded acquisition 3.4% DPU accretive on a pro-forma basis. Typically, large acquisitions would have to be funded via a mix of debt and equity as asset yields would be lower than stock trading yield. But in this case, it appears that MINT's 4.3% FY20F yield is lower than the data centre portfolio's yield. Based on past reports, data centre yields are between 5-7%. 

MINT is raising more than it requires with S$302.6m out of the S$350m going to the acquisition and the remainder being applied to pay off debt or kept for working capital purposes. While the general market is still reeling from the Covid-19 situation, MINT has performed well and is using its strength to raise more capital. Interestingly, even though it fully funded the acquisition by equity and even raised more than it needs, MINT's proforma aggregate leverage is expected to increase from 37.6% to 38.7%. 

MINT use of funds (Source: MINT)

Overall I think this is a good acquisition for MINT and shows that it is making full use of its strong share price to raise capital. It was trading at almost 1.8x P/B before it was halted this morning. This acquisition also reminds the market of the importance of having a strong sponsor that can support the REIT in tough times with a growth pipeline. I believe that MINT would not have been able to make a deal with a 3rd-party in this climate as asset-owners continue to cling on tightly to data centre assets. 

Looking ahead, MINT continues to have a growth pipeline in the form of the 2nd and 3rd data centre portfolios that it acquired in 2019 together with its sponsor. Like the current redwood acquisition, I believe that it is only a matter of time before MINT can acquire those sponsor stakes too. In addition to an acquisition-led growth in data centres, MINT could also continue to redevelop its old flatted factories (~22% of portfolio) into high-spec properties just like what it is doing at Kolam Ayer. 
Share
Tweet
Pin
Share
No comments
Newer Posts
Older Posts

Popular Posts

  • MSCI Singapore Index rebalancing impact on stocks
  • Office REITs results round up: WFH a boon or bane?
  • 3 key concerns REIT investors should take note of

Tags

  • Centurion Corp
  • Consumer
  • Covid-19
  • Coworking
  • Eagle Hospitality Trust
  • Gloves
  • Healthcare
  • Index
  • Property
  • REITs
  • Sembcorp
  • SPH REIT
  • Supermarket

Blog Archive

  • ▼  2021 (3)
    • ▼  6 Jun - 13 Jun (1)
      • ARA Logos Logistics Trust: 3 reasons to drive a re...
    • ►  21 Feb - 28 Feb (1)
    • ►  24 Jan - 31 Jan (1)
  • ►  2020 (43)
    • ►  30 Aug - 6 Sep (1)
    • ►  23 Aug - 30 Aug (1)
    • ►  9 Aug - 16 Aug (1)
    • ►  2 Aug - 9 Aug (2)
    • ►  26 Jul - 2 Aug (2)
    • ►  19 Jul - 26 Jul (2)
    • ►  12 Jul - 19 Jul (2)
    • ►  28 Jun - 5 Jul (2)
    • ►  21 Jun - 28 Jun (2)
    • ►  14 Jun - 21 Jun (2)
    • ►  7 Jun - 14 Jun (2)
    • ►  31 May - 7 Jun (1)
    • ►  24 May - 31 May (3)
    • ►  17 May - 24 May (1)
    • ►  10 May - 17 May (3)
    • ►  3 May - 10 May (2)
    • ►  26 Apr - 3 May (3)
    • ►  19 Apr - 26 Apr (1)
    • ►  12 Apr - 19 Apr (2)
    • ►  5 Apr - 12 Apr (2)
    • ►  29 Mar - 5 Apr (2)
    • ►  22 Mar - 29 Mar (2)
    • ►  15 Mar - 22 Mar (2)

Created with by ThemeXpose