• Blog
  • About
Powered by Blogger.

Path to prosperity

The airline industry has been one of the most badly hit by the Covid-19 pandemic as international air travel ground to a halt. Even as there are green shoots of recovery in the economy and green lanes are opening up, air travel is still >90% down from pre-Covid levels. In light of this, investors have been reconsidering their stakes in the industry. I recently read an article about the recovery in the airline industry being unequal and would like to give my take on the points mentioned. Generally, it argued that the characteristics of low-cost carriers ('LCCs') would allow it to recover faster than full-service carriers. 

1. LCCs serve point-to-point destinations

Direct flights reduce the number of points of contact during travel and could give passengers greater peace of mind when travelling. We have seen pictures and videos circulating around of passengers in full PPE suits in airports and this further highlights the concerns passengers have about being locked up with strangers in a flying metal box for a few hours. LCC typically serve direct flights vs full-service carriers like SIA, which operate more of a hub and spoke model. 
Passengers at Changi Airport ready with PPE

2. LCCs operate regional flights 

Operating regional flights could be a plus in this case as passengers would want to reduce the time spent in an aeroplane. Such flights are closer and are within the tolerable risk perception of travellers. Additionally, the recession brought about by Covid-19 could lead households to tighten purse strings and opt for regional destinations. LCCs that operate in countries with domestic travel should start to see shoots of recovery with governments pushing hard to boost domestic tourism. 

3. LCCs serve leisure travellers

The profile of passengers for LCCs tends to be leisure travellers as their price-sensitive nature is met with competitive prices from LCCs. On this front, I'm not sure if this is positive or negative for LCCs. On one hand, corporate travel is likely to be cut back with weakening profitability whereas leisure travel is always likely to be around due to an intrinsic nature to explore new places. On the flip side, corporate travel is many times more likely to be classified as 'essential travel' that can restart sooner. 

Additional points of consideration would be survivability. Full-service carriers with strong backing from governments should have much better support during these times and are less likely to fall into financial ruin. This is evidenced by SIA's S$8.8bn rights issue supported by Temasek. The longer the pandemic drags on, the less likely non-government-backed LCCs can survive. 
Share
Tweet
Pin
Share
No comments

As the world experiences an uneven recovery from the Covid-19 virus, investors continued to pile into markets driving the S&P and NASDAQ indices to all-time highs. The divergence between reality and stock markets have been explained by some as the lack of any viable alternatives for return as interest rates have plummeted. 

On the S-REITs front, industrial REITs have continued their outperformance while hospitality and retail continue to lag. In this article, I will explore some general concerns investors have regarding REITs in order to provide readers with more tools to evaluate REITs. 

1. Have equity valuations fully accounted for real estate valuations?

In my opinion, the short answer is 'No' as most valuations would have been done at the last year-end, generally being Dec 2019. In Dec 2019, Covid-19 was still in its nascent stages and valuers were unlikely to have factored in the profound changes that the pandemic has brought about. As cashflow and growth are inputs of certain valuation methods, I think the decline in both would lead to lower valuations when assets get revalued soon. 

An example of this valuation decline from book value would be OUE Limited's sale of US Bank Tower for US$430m vs its book value of US$650m (~1/3 lower!). Additionally, I do believe that asset owners are holding back on conducting asset revaluations as this could have a negative impact on loan covenants (Ie. fall in asset value leading to higher LTVs). 

2. Could leverage limits be breached?

Leading on from my previous point, this is certainly true as valuations decline. The key concern about breaching leverage limits would be the implications on capital structure. If a REIT is close to breaching the limits, it is more likely to embark on equity fundraising (possibly dilutive). This could be why we are seeing smaller premiums (or larger discounts) attributed to REITs with >40% gearing like ESR REIT and ARA Logos Trust. From a pure property investment standpoint, a 40% LTV is not actually something to be very worried about as private funds do not have such limits and tend to go over 50% LTV. However, being a REIT comes with this trade-off of extra regulations. 

For investors with a longer memory, S-REITs undertook extremely dilutive equity fundraisings during the GFC period headlined by blue-chip names like Mapletree Logistics Trust and Capitaland Commercial Trust. That exercise caused a crash in REIT stock prices; the crash was a short-term one and REITs subsequently had a strong run until 2019. 

3. When will things go back to normal?

Due to the difficulty in quickly testing for Covid-19, I believe that a return to the old norm will come only when a fast test and a vaccine are found. As earlier mentioned, different REIT subsectors have had different impacts from Covid-19. Subsectors like data centres and logistics are strong beneficiaries from the shift to a virtual economy and stay-at-home nature that comes with Covid-19. Others like hotels have been decimated while the future of retail and office are still up in the air. 

For both office and retail, I believe that the longer the pandemic lasts, the more people would be accustomed to flexible working and online shopping respectively. Covid-19 has accelerated nascent trends and this may not be reversible. On the flip side, we have also been seeing office workers pining to return to office as work-from-home arrangements have caused additional stress. Shoppers have also been craving the full sensory engagement that comes with seeing and touching items. 

As for hospitality, while it is a short term mega loser, I do think that in the long run, it will recover more than office and retail, especially leisure travel. Corporate travel could be somewhat hampered by greater adoption of virtual conferencing but leisure travel is something I believe society is itching to go back to. Of the top 5 oldest business that have been around since before 1300, 4 of them are hotels. This further emphasizes the intrinsic need that humans have for exploration and discovery. 

Conclusion

While the market continues to power on, I do think that the Covid-19 situation has shown the importance of having a strong balance sheet and survivability. These are characteristics that are present in most REITs as they have strict gearing limits and have cashflows backed by assets.  When the time comes, I believe REITs will come back in favour. 
Share
Tweet
Pin
Share
No comments

PropNex released its 1H20 financial results and reported a 151% surge in net profit after tax to $16.0m. According to PropNex the key driver of earnings growth was the project marketing services segment, which had revenue growth of $75.1m vs total revenue growth of $75.2m. As this is a higher margin segment relative to the resale market, there was an increase in gross profit margin to 11.4% in 1H20 vs 9.8% in 1H19. 

PropNex 1H20 Results (Source: PropNex)

In previous quarters, PropNex mentioned that transactions usually would have a 1-2 quarter delay from the time the agreements are signed until the time PropNex is actually able to recognize revenue. Hence, we can deduce that the strong showing in 1H20 can be attributed to the stronger 2H19 in property sales. 

Due to Covid-19 and the ensuing Circuit Breaker in Singapore, 2Q20 sales volume was strongly affected as there was a 37.6% qoq decline in private residential properties sold from 4,269 to 2,664. I believe that this would negatively impact 3Q and 4Q results and do not rule out a >20% decline in net profit in the coming quarters. 

Outlook

PropNex believes that despite the headwinds brought about by weaker economic growth, demand in the property market can continue to be resilient due to a few factors
  1. Lower interest rates to reduce the cost of buying properties with a mortgage
  2. Developers adjusting their prices to more competitive levels
  3. The weaker economic environment could help keep prices stable
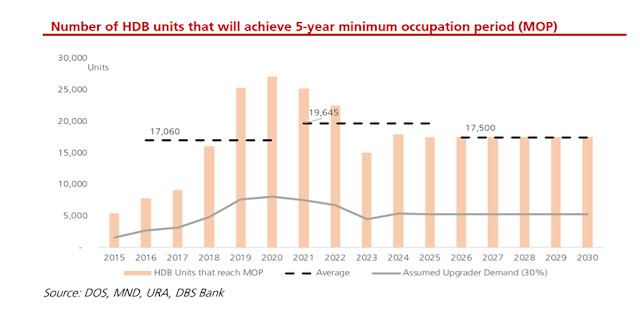
PropNex also estimates that there could be 8,000-8,5000 new home sales in 2020 with a total of 14,500-15,500 total units (including resale) vs 19,150 in 2019. On the HDB front, PropNex forecasts HDB resale volume to be between 20,000 to 22,000 for FY20 vs 23,714 in 2019. The softer decline in HDB volumes reflects the relative affordability of public housing and also the large chunk of flats reaching their MOP in 2019/2020. 

Takeaways

While I agree that lower interest rates make it conducive for buyers, it also increases the holding power of sellers who may not have adjusted down their selling price expectations. Therefore, transaction volumes may continue to remain low. The generous support provided by the government to businesses and individuals also helps to alleviate some of the financial pressures facing homeowners, in turn, lowering any urgent need for liquidity. 'Desperate' sellers could be HDB upgraders who have to sell their property. 

On the topic of HDB upgraders, it was initially expected that 2020 would see a bumper crop of them due to the large number of HDB flats reaching their 5-year MOP. However, in light of the pandemic and uncertainties, I believe that a number of upgraders could have held back their upgrading plans until their job outlook becomes more certain. Assuming timelines are pushed back by 1 year, this could also result in 2021 having a super crop of 5-7 year-old HDBs being on the resale market. With completions of the latest BTO launch expected to be in 2025-2027, anxious homebuyers could turn to the resale market instead. 

Another area to look out for is potential fire sales from developers racing to beat the ABSD deadline. In Jun 2020, we saw an instance of this (https://www.businesstimes.com.sg/real-estate/to-beat-absd-38-jervois-developer-launches-fire-sale-to-clear-units) when the developer of 38 Jervois slashed prices by up to $500,000 (13-24% discount) to avoid the ABSD. Unless absolutely necessary I believe that developers will try to hold on to their prices as major price cuts could result in options not being exercised, angry buyers who bought earlier or even impairments. 
Share
Tweet
Pin
Share
No comments

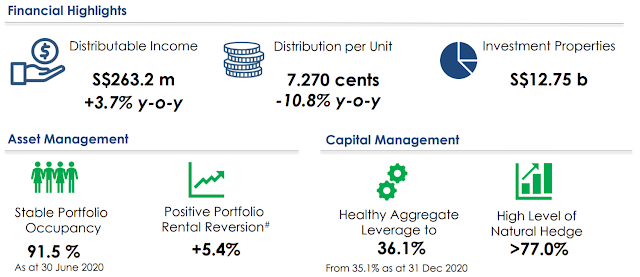
Ascendas REIT announced their results about 2 weeks ago and reported a 3.7% growth in distributable income but a 10.8% yoy decline in 1H20 DPU. Broadly speaking results were seen as positive despite the Covid-19 pandemic raging on in other sectors. Positive rental reversions, especially in business parks, were encouraging and gearing of 36.1% continues to provide AREIT with a healthy debt headroom for acquisitions. In this article, I would like to focus on key points brought up during the analyst briefing that investors may have missed if they merely looked at the announcements on SGX.

AREIT 1H20 results highlights (Source: AREIT)

1. Positive reversions in the face of weakening outlook not weird at all

At first glance, it seems weird that AREIT could report +4.0% positive rental reversions in Singapore and +4.3% for the total portfolio despite the weakening outlook. However, management has revealed that a number of these discussions had already started taking place before Covid-19 hit and that properties were also under-rented relative to market. The positive reversions represent a mark-to-market of expiring rents rather than an actual growth in market rents. 

In particular, the management highlighted business parks as a bright spot with multiple instances of 20%+ reversions. The specific example given was that of an international bank renewing its lease at Changi Business Park for >20% reversion on a new 3-year lease for the same space (no reduction or expansion in space). CEO also highlighted that this was a positive read-through for the business park segment. 

For the rest of FY20, the management has guided for mildly positive rental reversions but cautioned that this was not indicative of the direction that the market was moving in. A better gauge could be looking at occupancies instead. 

AREIT rental reversions (Source: AREIT)

2. Logistics demand more transient in nature

Much has been said of the new-found stability and strength of logistics tenants that support e-commerce and Covid-19 related stockpiling. However, during the analyst briefing, AREIT did not believe that those 2 would drive the logistics sector much higher. 

Firstly, Covid-19 related stockpiling appears to be done on leases <1 year. Therefore, should the pandemic subside, landlords could see a decline in demand for such spaces. In the short term, we can probably see an improvement in rents from such short leases as they tend to be higher than leases with longer commitments. Such short leases also did not really have an impact on rental reversions as reversions only account for renewal leases >12 months. 

Next, while e-commerce has been doing well, it does not make up the bulk of leasing demand for logistics spaces. Instead, AREIT CEO mentioned multiple times that logistics demand in Singapore is driven by contract manufacturing and ~80% of it serves international markets. Therefore, the key catalyst for logistics would be whether Singapore can continue to attract contract manufacturers here and if product demand remains at current levels. 

Generally, excluding the transient demand from Covid stockpiling, the management said that the new take up is weaker and occupancy could trend down in the near future. 

3. Acquisitions and AEIs, while delayed, continue to be on the cards

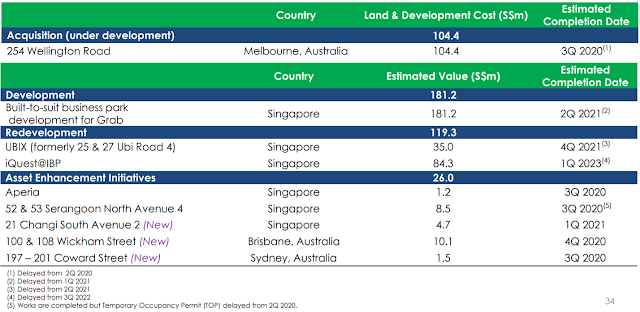
It should come as no surprise that AREIT is reporting delays in the estimated completion dates for its AEIs and redevelopments due to the outbreak at the foreign worker dormitories. Nonetheless, asset enhancement plans continue to be on track and AREIT also announced 3 new AEIs (2 in Australia 1 in Singapore). 

There were also questions on potential acquisitions from the sponsor in Singapore and also overseas. Due to the sensitive nature of such transactions, management could only give very broad motherhood statements; they continue to be interested and have conversations with the sponsor and are doing what they can to unlock opportunities. Deals are coming back and it seems like we may see an overseas one before anything local; anyway, AREIT already did 25% of Galaxis earlier this year.

In terms of strategy, AREIT maintains that it would focus on sectors that drive economic growth like tech and bio-med. In the UK they continue to like logistics and business parks. They also continue to monitor opportunities in data centres. AREIT has a sizeable exposure to data centres from an absolute GFA perspective, however it does not pop out as much due to AREIT's size. Singtel (one of their top 10 tenants) leases data centre space from AREIT. From a pricing standpoint, the management highlighted that lower interest costs also improved the holding power of sellers and hence AREIT is not really seeing any 'Covid-pricing' yet. 

AREIT AEIs in progress (Source: AREIT)

4. DPU decline despite no retention and outlook

One analyst asked about a decline in DPU to around 3.6cts per qtr vs 4.0cts per quarter in 2019. This appeared odd given that AREIT did not retain any income and that the US acquisition in 2019 was supposed to be DPU accretive (+0.7%). To this question, the management highlighted that there were certain one-off distributions in 2019 like the rollover adjustment that contributed to about 0.25cts of distribution. 2020 results also had to account for rental reliefs given to tenants due to Covid-19 and also declines in occupancies leading to lower operational results. 

Looking ahead, one area that AREIT is poised to reap some savings is on interest cost. AREIT has some perps coming up on their reset date and whichever option it chooses to take (reset, refinance, issue bonds), AREIT is confident that there will be interest cost savings. Apart from this, most of the outlook really depends on how the Covid-19 virus progresses. 

In comparison to its Capitaland peers, AREIT has outperformed and even hit above $3.50 last week. Due to this, and the fall-off of CMT, AREIT remains the largest and most liquid REIT in Singapore. Trading at ~1.6x P/B and 4.3% FY20F yield, AREIT is in a good position to continue its growth via acquisition strategy. On the flip side, its size also means that acquisitions won't really move the needle much and AREIT does have to make portfolio-size acquisitions to continue its growth trajectory. 

Share
Tweet
Pin
Share
No comments
Frasers Logistics & Commercial Trust (FLCT) announced its 3QFY21 business update last evening. This is the first set of 'results' announced after the completion of the merger between FLT and FCOT. Due to the larger entity and mix, most of the yoy comparisons are not that meaningful since all show a huge increase due to the merger. To better assess how FLCT performed, we have to zoom into the details

1. Positive reversions for commercial but negative for industrial
During the quarter FLCT completed 134,669 sqm of leasing deals in total and achieved +10.6%/-3.9% reversions for its commercial and industrial segments respectively. The rental reversions are calculated as the new gross signing rent divided by the old terminating gross rent. 

I believe that the +12.1% reversions experienced for the 10 leases in Singapore could reflect the lower signing rents that were achieved 3-5 years ago just as the office cycle was picking up. Nonetheless, it is a commendable result especially during the Apr-Jun period which was right in the eye of the Covid-19 storm. 

For industrial rents, the negative reversions could be due to the annual increments from the previous lease being higher than the average market rental growth. Hence any reversions back to market would be a negative one. This was previously the reason cited for the negative reversions for Australian logistics properties by the FLT management. Although we prefer a positive number, I believe that the slight negative is outweighed by the longer lease terms and annual increments that are in-built into these industrial leases vis-a-vis commercial leases with little/no increments.
Leasing update (Source: FLCT)

2. Occupancies inched down but upcoming expiries low
Portfolio occupancy was 97.2%, which was held up by the strong performance of logistics (99.8%). On the commercial side, only 1 out of 6 properties registered an increase in occupancy. The weaker occupancy is largely expected due to the Covid-19 situation with tenants probably rationalizing their space requirements. Looking ahead, investors can take comfort that upcoming expiries are low (<10% in the next FY). 
FLCT Lease Expiry Profile (Source: FLCT)

3. Capital recycling amidst the pandemic
FCLT also announced the acquisition and divestment of properties following the quarter-end. It would be divesting its remaining 50% stake in its Cold Storage Facility for S$152.5m and acquiring 2 properties (logistics in Melbourne and business park in the UK) for S$89.9m. The new properties have a WALE of 4.9 and 6.7 years respectively and are both 100% occupied.

As the management mentioned that the transactions are expected to be accretive, I believe that the exit yield on the divestment is lower than that of the purchase yield on the acquisitions. 

Summary
Overall, FLCT produced a commendable set of results and continues to undertake transactions even during the pandemic. I like that the management has consistently executed 2-3 transactions every year to grow the REIT and also like the stability of the overseas logistics/industrial assets with their long leases and annual step-ups. However, one thing to note is that FLT previously experienced share price underperformance in 2018/2019 due to its FX exposure since all its assets were non-Singapore before the merger. Therefore, investors should be comfortable with the FX risk on the AUD, EUR and to some extent, the GBP. 
Share
Tweet
Pin
Share
1 comments
Singapore Airlines (SIA) released its 1QFY21 results this evening. SIA reported a 99.5% decline in passenger volumes which led to the headline $1bn net loss. While passenger volumes across its different segments fell by >99%, cargo performed better with a 55% fall in cargo and mail carried. Quite interesting to have your volumes decline by >50% but still be the best performing segment. This goes to show how bad things are for the airline industry. 


Outlook
In its outlook statement, SIA mentioned that the recovery in international air travel is slower than expected and industry experts have continued to revise their projections downward. A full recovery could take 2-4 years according to industry forecasts. For SIA, its own forecasts are that passenger capacity would not reach 50% of pre-Covid levels by the end of FY21 (Mar 2021) and will continue to re-assess its fleet size and network. For the end of 2QFY21, SIA projects that its passenger capacity would be c.7% of pre-Covid levels, a >7x jump from the current levels of <1% of pre-Covid. 

SIA appears more positive on cargo recovery as the reopening of economies and manufacturing plants could imply a greater need for air freight. It is also looking to deploy cargo-only passenger flights when justified. SIA currently has 7 freighters and 33 passenger aircraft that are deployed on cargo-only services. 

When the recovery comes possibly in 2022, SIA will also have to bear the extra maintenance costs of getting their parked aircraft back to air-worthy shape. It currently has 119 aircraft parked at Changi Airport and 29 in Alice Springs. I also do hope that by 2022, most of SIA's high fuel hedges have worn off and SIA can start getting better margins. 

On the bright side, SIA has raised $8.8bn from the rights issue and secured other lines of financing worth c.$2.2bn since Mar20 and this could put it in a better shape vis-a-vis competitors who may not have the backing of a strong parent. We have also seen other airlines like AirAsia having going concern issues and this could be a slight positive when the recovery does come for surviving airlines. 

Overall, I believe that this set of results is more negative than expected and could lead to a further softening of SIA share price. 
Share
Tweet
Pin
Share
No comments
Ascott announced its results earlier today and it wasn't pretty. Ascott had earlier set out profit guidance that distributable income could drop between 55-65% and DPU could decline by 65-75% for 1H2020. Looking at the actual results, the guidance was fairly accurate as DI declined by 56% while DPU dropped by 69%. 

I believe the decline would have been even worse if Ascott had compared it on a same-store basis since there was the merger between Ascott and Ascendas Hospitality that would have boosted the distributable income. During 1H2020, 21 of Ascott's properties were temporarily closed due to the pandemic. Since then, 12 properties have reopened and 7 more are scheduled to reopen in 3Q20. 

Operationally, we also saw the benefit of having master leases or management contracts with minimum rents. From a gross profit standpoint, management contracts experienced the worst decline of -61% while master leases actually grew 51%, although partially contributed by the Ascendas merger. 
Ascott financial performance of various segments (Source: Ascott)

Ascott has further highlighted that it has a highly diversified set of revenue streams from a geographical perspective and this could help with the recovery. As mentioned in a previous article, exposure to non-Singapore countries allows Ascott to ride on the push for domestic tourism compared to its SG-focused peers. The higher APAC exposure also allows it to ride on the strong response to Covid that APAC countries have had relative to Europe and the US. 
Ascott gross profit contribution by country (Source: Ascott)

I expect Ascott's hotel-focused peers to be even worse off as serviced residences tend to have a more stable occupancy due to longer stays. Additionally, in its largest country, Japan, Ascott actually has residential properties that it is renting out, which provides further stability to income. 

At its current price of 90cents, Ascott provides an annualized yield of 2.3% (taking 1.05Scts multiplied by 2). In reality, the yield could be around 2.5% assuming Ascott pays out the amounts retained. At such low yields, I do not believe that investing in Ascott shares provide good risk-return ratio. In fact, investing in their perpetuals might be a better choice since it has seniority over common shares and provides a higher yield at 3.07%. 
Share
Tweet
Pin
Share
No comments
Yesterday both Keppel DC REIT (KDCREIT) and Mapletree Industrial Trust (MINT) released their results for the quarter ending Jun2020. Both REITs have performed strongly after their end-Mar lows due to their exposure to data centres. MINT has performed more strongly even though it only has a 32% exposure (by AUM) to data centres vs KDCREIT's 100% exposure. I think this could be due to the more visible growth pipeline of MINT from its sponsor's stakes in the US data centres and also redevelopment opportunities at its existing non-DC assets. 

KDCREIT Results
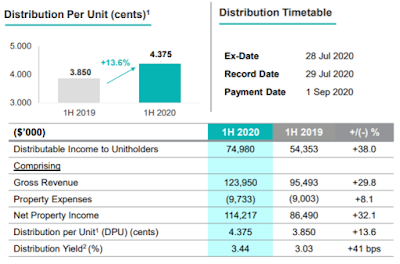
KDCREIT reported a 1H2020 DPU of 4.375 Scts which as a 13.6% improvement yoy. This was due to new acquisitions of SGP4 and DC1 in 2019 as well as the latest acquisition of Kelsterbach DC in May 20. Based on the 1H2020 closing price of $2.54, this represents a 3.44% annualised distribution yield. As all of KDCREIT's tenants are in the data centre business, they were not subject to any shutdowns and hence did not require any rental reliefs/support from KDCREIT. KDCREIT was thus able to payout 100% of its distributable income. 
KDCREIT Results
KDCREIT Results (Source: KDCREIT)

MINT Results
For MINT, it reported a 1QFY20/21 DPU of 2.87 Scts which was 7.4% lower yoy due to rental rebates extended to tenants due to Covid-19 as well as holding back tax-exempt income of S$7.1m to mitigate the impact of mandated rental reliefs. According to MINT, if such income was not withheld, DPU would have been 3.19 Scts, representing a 0.09 Scts increase yoy. The amount held back was about 10% of its 70.6m distributable income. 
Breakdown of sub-asset classes by AUM (Source: MINT)

In my opinion, MINT continues to be held back by its legacy portfolio of flatted factories and older business parks as shown in the negative rental reversions as well as lower new rents achieved during the period. However, investors could possibly see this as 'land bank' to be redeveloped into more future-ready assets. Given MINT's management's strong execution track record, there could certainly be more redevelopment opportunities like 30A Kallang Place and Kolam Ayer. 
MINT Rental Rates (Source: MINT)

It is hard to overstate the attractiveness of the data centre asset class during the Covid-19 period where businesses have been forced to digitize and people have been working from home. More importantly from a real estate perspective, data centre leases tend to be long (KDCREIT's WALE of 7.4 years) and provide a steady stream of income so long as service level agreements are met. 

At their current trading levels, it appears that both KDCREIT and MINT are in a virtuous cycle as their trading yields (3-4%) are much lower than data centre cap rates (5-7%). This would allow them to make accretive acquisitions even with a greater proportion of equity funding. In turn, this growth potential can further drive up the share price and make it even easier for either to make accretive acquisitions. 

Investor optimism has certainly showed up in their strong price growth and I believe that investors are pricing in additional acquisitions. Therein lies a certain amount of risk if the REITs are unable to find assets to acquire and meet investor expectations. 
Share
Tweet
Pin
Share
No comments
Today in addition to Keppel REIT releasing results, CCT also released the minutes of their AGM. Both events can help give investors an insight into what has happened in the office market and what we can expect going forward. This article will attempt to summarize some of the key points from the two releases. 

1. Slower leasing and a shift to renewals
The pace of leasing has been slower as marketing and property visits have been postponed. CCT also mentioned that it has seen more renewals coming in as tenants want to minimize capital expenditure. Both CCT and KREIT cited that their high tenant quality was important in keeping occupancies high and allowing them to collect rents on time. There have also been no significant requests to downsize. 

During this period, CCT highlighted flex space operators as being more affected as their members defer or waive memberships. This is usually highlighted as the downsize of flex space operators as they incur long term rent expenses but with short term membership revenues. On the bright side (for CCT), the WeWork lease at 21 Collyer Quay remains on track and there has been no indication of a withdrawal. 

2. Earnings to weaken due to rental reliefs and higher expenses
KREIT cited rental reliefs as a reason for weaker property income. Zooming out a little, we expect NPI margins to compress due to higher cleaning and digitizing expenses incurred by office landlords in making their properties suitable for a return to work. While this is somewhat already expected, the investing community is still waiting on more specific guidance on how much earnings would weaken (similar to what the hospitality players have disclosed recently). 

In their outlook statements, both KREIT and CCT mentioned that the impact is still hard to assess and they would continue to be prudent in distributions. 

3. Demand down but supply is also lower
As generally known, demand for office space follows economic cycles and it is up to developers and urban planners to manage the supply of office space. While demand is expected to decline, Covid-19 has also resulted in construction and renovation works being pushed back and thus reducing new supply in the next few years. Furthermore, developers could also take the coming few years of weak demand to undertake redevelopments and asset enhancements at their properties. Examples of this are AXA Tower and Keppel Tower. 

Overall while the impact from Covid is still limited to the first-degree impact from rental reliefs, I think that we can see higher vacancies and even negative rental reversions in the coming years as leases expire. Office demand will not collapse as fast as hospitality and landlords generally remain fairly positive about the long term potential of office. The slide below from Keppel REIT sums the discussion up quite aptly. 

Share
Tweet
Pin
Share
No comments
In the past week or so we have had companies coming out to give profit guidance. A profit guidance is issued when a company feels that the market expectations of its financials are significantly over or understated and needs analysts to realign their forecasts. This article will focus on the 3 travel-related companies that had such announcements. 

Ascott REIT
Ascott issued a profit warning at the start of the week citing that income available for distribution for 1H2020 could decline by 55-65% yoy while DPU would decline 65-75% yoy. The larger decline in DPU was probably due to the divestment gains from Ascott Raffles Place in 1H2019. Declines are attributed to the Covid-19 pandemic which have led to a 44% yoy decline in international tourist arrivals according to the World Tourism Organization from Jan-Apr2020. On a full-year basis, the decline is expected to be 58-78% yoy . 

Ascott REIT continues to earn income from its master leases and long stay clients whose demand is less affected by the pandemic. Additionally, as mentioned in an earlier post, the gradual opening of certain countries' domestic tourism could be a slight boost to occupancy as the REIT is geographically diverse and present in countries with some sort of domestic tourism (vis-a-vis Singapore). 

ARAUSHT
On 17 Jul 20, ARAUSHT announced that the pandemic had resulted in a significant decline in gross revenues such that it expects to report a net property loss and no distributable income for 1H2020. This is probably the first time we see a REIT or BT having no distributable income! ARAUSHT is a high-beta play on the US hospitality industry as it does not have a master lease structure and net property income fully depends on hotel demand. 

When it was listed together with Eagle Hospitality Trust in 2019, ARAUSHT was seen as a safer play due to the sponsor's brand name and presence of more cornerstone investors. However, in a situation like this, I feel that Eagle's structure would have provided more comfort to investors as they had master lease income (notwithstanding the sponsor's default). 

SIAEC
SIAEC announced 1Q21 business updates and mentioned that flights handled in the quarter was ~13% of pre-Covid levels. On the costs side, the impact was partially offset by the Job Support Scheme given by the Singapore government; management and BOD had also taken pay cuts. Revenue was down 54% as flights handled declined 87% yoy and SIAEC reported an operating loss of $8.6m vs $17.7m profit in 1Q20. Without the JSS, its loss would have been $36.7m. Management also mentioned that the pick up in June was not material and outlook for the MRO business will be challenging. 

Thoughts
Looking ahead to the other hospitality REITs, we are likely to see similar trends where REITs with master leases experience a smaller decline in income while those like ARAUSHT can see their distributable income wiped out (or close to being wiped out). I continue to believe that players with overseas exposure will be more cushioned against the revenue declines (ceteris paribus) as larger countries do have substantial domestic travel demand. 

Flights handled is also a good forward indicator of hospitality revenues as Singapore's hospitality receipts are almost entirely dependent on foreign tourists. A side revenue that could gradually taper off is the use of hotels for 'Stay home notice' and 'Quarantine' of travellers that recently entered Singapore. The hope now is that this quarter would represent an earnings trough as it covered the periods worst hit from Apr-Jun. Looking forward to see what results are like in the coming weeks!
Share
Tweet
Pin
Share
No comments
This morning ESR REIT announced a proposed merger with Sabana REIT. 

Transaction details
0.94 new ESR REIT units for every 1.0 Sabana units held. This is an all-stock deal with no cash consideration to be paid out (unlike the previous ESR-Viva deal). ESR units would be issued at an indicative price of $0.401 (vs last traded at $0.39) while this implies a $0.377 price (vs last traded $0.36) for Sabana units. 

Rationale
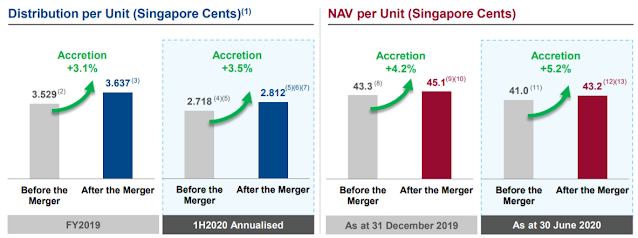
1. DPU and NAV accretion - According to the pro-forma, this would be DPU accretive to ESR REIT shareholders by 3.5% while Sabana shareholders would enjoy a 12.9% accretion. What is slightly positive to unitholders is that any income retained would have to be paid out before the effective date of completion. In the past quarter, DPU was affected due to amounts retained for Covid-related purposes. 

The higher accretion by Sabana could also be a function of the management fees being 60% paid out in units vs 100% cash previously as the pro-forma assumes that Sabana's fee structure follows that of ESR's. Looking at the fee structure, the base fees are both 0.5% of the deposited property. There could be some savings from the performance fee perspective as ESR has a high watermark of 6 cents DPU (following which perf fees is 0.25% of the increase) which it is unlikely to hit in the next few years vs Sabana's 0.5% of NPI if DPU grows by 10%. ESR also has a lower trustee fee of 0.1% of deposited property vs 0.25% for Sabana.

One point to note is also that the enlarged REIT would not be maintaining its Shariah compliance so this could save additional costs. According to Sabana management, they have been reviewing the Shariah compliance over the years as it appears that the cost of compliance has outweighed the benefits from having an additional pool of investors. 

DPU and NAV accretion (Source: ESR REIT)
 
2. Shift in portfolio exposure - The merger will allow the enlarged ESR REIT to have greater exposure in high-specs and logistics properties. I think this is a positive as high-spec properties have enjoyed strong demand due to their future-ready characteristics while logistics properties have been the flavour of the year given the increased need for logistics services during lockdowns. 
Sub-asset class exposure (Source: ESR REIT)

3. Operational synergies - The REIT Manager posits that the merger could bring about operational synergies from a marketing and leasing perspective. There could also be cost savings due to consolidation of contracts and stronger bargaining power as a result of becoming a larger entity. While I agree with this in theory, in practice, we have yet to see major cost synergies from the previous ESR-Viva merger. This could be due to maintenance contracts not expiring. Also in relative terms, Sabana increases the estimated GFA by about 27%, so not that sure how much incremental benefit ESR can extract out of the merger. 

4. Size and cost of capital - To me this is one of the strongest rationales for the merger. As a larger and more established entity, ESR REIT would be able to secure more competitive rates from both the banks and the market. Evidence of this is already provided when it managed to refinance Sabana REIT's debts and reduce the cost of debt from 3.8% to 2.5%. 
ESR REIT cost of debt (Source: ESR REIT)

In theory, I believe that this is possible, the true extent of the savings is hard to estimate without further disclosure from the REIT. The lower rates are probably also a function of the lower base rates in 2020  and then slightly offset by the longer debt tenor and the lack of encumbrances. Best is if we know the interest margin pre and post refinancing. 

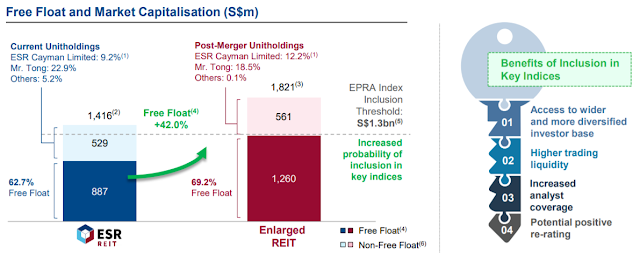
On the equity front, I am excited that the larger free-float market cap promised by the merger could possibly lead to inclusion in the EPRA NAREIT Index. Index inclusion has been a strong driver of REIT share prices in 2019 and I think the benefits of a re-rating cannot be overemphasized. For the longest time, ESR has had trouble being included as its largest shareholder, Mr Tong Jinquan, did not want to reduce his holdings in the REIT. While this was a testament to his confidence in the REIT, this also prevented the REIT from accessing a greater pool of investors that comes with index inclusion. With the completion expected to be in Nov20, the earliest that ESR can be included (assuming it hits the threshold) is probably going to be in 1Q21. 
ESR free-float market cap (Source: ESR REIT)

Thoughts
Generally quite positive on the merger as I believe the larger platform can bring about most of the benefits that ESR purports it can. Looking at prices, there has been a divergence in the performance of larger market cap REITs vs small/mid cap ones and pushing itself to become a large market cap REIT is a step in the right direction. 

One big problem ESR always had post-Viva merger was the high gearing. As of 1H20, its gearing is 41.8% and in the merger announcement, it mentioned that its pro-forma gearing would be 41.7%. Which is weird if I look at the sources and uses since it appears that ESR is funding the deal 54% equity 46% debt. Implicitly I would have expected gearing to go up. Either way, the higher MAS gearing limit of 50% probably gave management sufficient comfort that they had some buffer if valuations come down even more. Pre-merger ESR also did a revaluation of its assets and thankfully the decline was <2%. 
Merger Sources & Uses (Source: ESR REIT)

Overall my stance remains that both sets of shareholders should vote for the deal as the larger platform would help. For shareholders that do not approve (or are unable to continue holding the REIT due to the lack of shariah compliance), they should sell their shares. 
Share
Tweet
Pin
Share
No comments
SPHREIT released its 3QFY20 Business Update this evening. This comes after it shifted to half-yearly reporting; the link to the presentation can be found here. Would like to highlight a few things to take note of:

1. DPU continues to be low but may not be because of a low payout ratio
SPHREIT declared a DPU of 0.5 Scts for the quarter representing an increase over 0.3 Scts declared in the last quarter. However, it did not disclose its distributable income hence we are unable to accurately calculate what the current payout ratio is. If we take last quarter's results, this represents a payout ratio of 33%, up from 20% previously. 

In all likelihood, 3Q distributable income would have been significantly worse off than 2Q as the quarter covered Mar-May which were the months which felt the most impact from Covid-related mall closures. Additionally, SPHREIT also announced that they were giving rental waivers for tenants. Therefore, the reduced DI would mean that payout ratio is probably more than 33%. 

2. Gulf in prime and suburban not as big
My original thesis was that prime district malls in Orchard//City area like Paragon would suffer substantially more than suburban retail due to the target audience. Apart from having a bigger residential catchment, suburban malls typically tend to have a larger proportion of 'essential' tenants like supermarkets and F&B. Whereas prime district malls tend to have a larger percentage of high fashion and targets discretionary and tourist spend. Therefore I expected suburban malls to be substantially more resilient. 

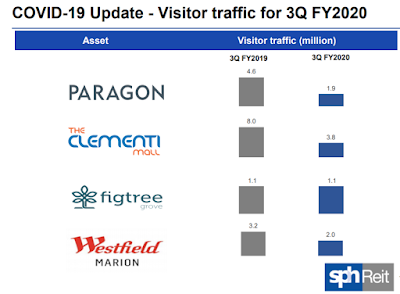
Looking at the visitor traffic figures, Paragon experienced a 58% decline in traffic while Clementi Mall's traffic declined 53%. Would have thought that the difference would be much bigger. My guess would probably be that pre-Covid Paragon was not overcrowded whereas Clementi Mall is frequently packed to the brim. Hence with a higher base there was much more room for traffic to fall at Clementi Mall. 
SPH REIT Footfall (Source: SPH REIT)

3. Occupancy remains high but what about rental reversion?
SPHREIT reported a committed occupancy of 98.8% across its malls in Singapore and Australia. Importantly, its 2 largest revenue contributors had occupancies of >99%! I think this is impressive as it probably implies only 1-2 shop lots are vacant. Going forward both Paragon and Clementi Mall have 28%/22% of lease renewals in FY21 and this will be a critical point to watch as leases do take time to expire. I also note that SPHREIT did not disclose its rental reversions in the presentation pack. We are therefore unsure if the high occupancies are a function of cutting rents. 

In the down-cycle that is coming, I believe that landlords will do well to shore up occupancy even if it is at the expense of rental rates. Unlike rental rates, occupancy is binary, either you are getting income from that shop lot or you are not. However, do hope that the REITs can be transparent in sharing such figures so that unitholders are well-informed. 
SPHREIT Occupancy (Source: SPHREIT)
Share
Tweet
Pin
Share
1 comments
Following the private placement by MINT to acquire the remaining 60% of its first US Data Centre portfolio, other REITs with strong balance sheets made moves recently. 

Ascendas REIT
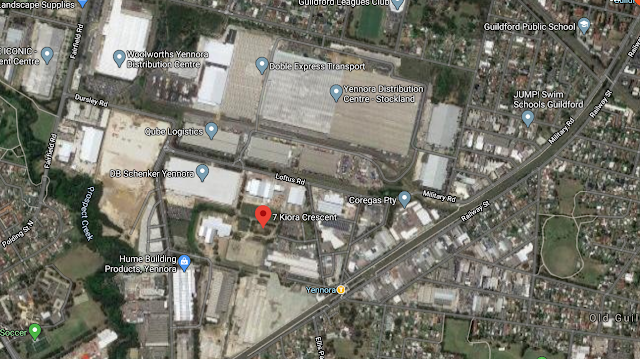
AREIT announced the acquisition of a yet-to-be-built logistics property in Sydney today (1 Jul 2020) for A$23.5m. The property will be developed by the Vendor and completed by 2Q2021. In the press release, AREIT mentioned that it managed to acquire the property at an almost 20% discount to its 'as if complete' valuation and this implies a 1st year NPI yield of 6.2%/5.8% pre and post-transaction costs. 

With a huge portfolio across Singapore, Australia and the UK, this acquisition barely moves the needle although AREIT says it is accretive to DPU. To unitholders, the REIT is also taking on development risk as the property is uncompleted and does not have a tenant. To mitigate this risk slightly, the Vendor is providing a 9.5months rental guarantee. 

REITs taking buying uncompleted assets or taking part in development means that their capital is tied up but not generating any income for unitholders (ie. not so efficient). However, as this acquisition is small, I do not think that there will be any noticeable impact on AREIT. Additionally, this method allows AREIT to gradually build up its portfolio accretively as they are unlikely to get good yields on completed (and fully tenanted) assets. The acquisition is expected to be fully funded by debt or internal resources hence the ability to get yield accretion. 
Google Map View of the acquisition (Source: Google)

Frasers Centrepoint Trust
The more sizeable acquisition was made by FCT's acquisition of an additional 12% interest in the PGIM ARF Fund for S$197.2m. This brings its interest in the fund to 36.89% from 24.82%. As a recap, the PGIM ARF Fund contains 5 retail malls and 1 office property in Singapore and 1 retail mall in Malaysia. Ever since FCT and its parent, FPL, started buying stakes in the Fund, their intention was always to absorb these malls into FCT eventually. 

According to FCT, this transaction will be DPU accretive on a pro-forma basis by +0.13%. The transaction will be fully debt-funded and would cause gearing to rise from 32.9% to 36.2% on a pro-forma basis. 

I like the transaction as it continues FCT's push to eventually own the entire Fund. The properties are all sub-urban retail which plays nicely into the Covid-19 resilience theme vis-a-vis prime district malls. Looks like FCT will continue to make bite-sized acquisitions of stakes in the Fund going forward. 

As mentioned in my previous post, I like the growth pipeline for FCT. Other than the PGIM ARF fund, it also has additional stakes in Waterway Point and Northpoint City that it can acquire going forward. A possible benefit of acquiring 100% of PGIM ARF is that FCT could then do away with the Fund structure and have these assets directly under FCT. This would save unitholders one level of fees; currently, I believe that unitholders are being charged fund management fees by PGIM ARF and REIT manager fees from FCT for every dollar that the PGIM assets generate. 

Both the AREIT and FCT transactions again emphasize the importance of having a strong balance sheet. For AREIT, it is large enough that bite-sized transactions can still be done without making too much of an impact on its balance sheet. While for FCT, it had always maintained one of the lowest gearing ratios historically, which allowed it to take advantage of opportunities when they arise. 
Share
Tweet
Pin
Share
No comments

Frasers Centrepoint Trust (‘FCT’) is a REIT that owns and operates 7 suburban malls in Singapore. FCT generates rental income from its malls that have a total of 1.4m sqft of net lettable area. The REIT is sponsored by Frasers Property Limited, which develops and manages a wide range of properties globally. While its share price has somewhat recovered, I think there is room for more premium than what the market currently accords to it. FCT continues to offer investors good value due to:

1. Visible pipeline for acquisition growth

FCT currently holds a 25% stake in PGIM ARF fund, which has 5 suburban malls with a total of ~1.0m sqft of retail space under the AsiaMalls brand. Its parent, Frasers Property (‘FPL’), holds 65% while the remainder is held by third parties. As part of a possible capital recycling strategy by FPL, the 65% stake could be divested to FCT given that the characteristics (type of malls and tenant mix) of the PGIM ARF assets are very similar to the type of malls FCT currently holds.

 Apart from acquisitions of stakes in the PGIM ARF fund, there is also the potential for FCT to increase its stake in Waterway Point, in which it currently holds 40%. The stake in Waterway Point was acquired in 2019 and this could go up once the mall stabilizes; Waterway Point is currently still within its first 2-3 renewal cycles which tend to be periods of stabilization in terms of tenant mix and footfall. Similarly, FCT could also acquire Northpoint City South Wing; FCT currently owns Northpoint City North Wing. Northpoint was reopened in 2017 after extensive asset enhancement works and is also yet to fully stabilize according to FCT. 

2. Dominant malls in regions with low floorspace per capita in Singapore

FCT’s 2 biggest revenue contributors, Causeway Point and Northpoint City North Wing, have dominant positions in the Northern part of Singapore. The Northern part of Singapore is also the region which has the lowest shopping mall floor space per capita according to a Cistri report in Aug 2019. This implies that both malls have an excellent catchment of residents and have less competition compared to other regions.

Floor space per capita (Source: Cistri)

3. Suburban retail to remain resilient amidst Covid

Suburban retail malls differ from their prime district counterparts in terms of tenant mix, with a higher proportion of tenants being in essential goods and services (ie. Supermarkets and F&B outlets). In the latest retail sales figures released by Singstat, Supermarkets and Convenience Stores were the only 2 categories that registered yoy and mom growth.

FCT is well-exposed to these sectors as shown in its portfolio trade mix where about 50% of its gross rental income is derived from F&B, Household and Supermarket tenants. The coming Covid-19 induced recession also plays to the value proposition of suburban malls, which is to have products that have accessible pricing relative to prime district malls. With consumers tightening their purse-strings, the search for value items could divert spending towards suburban malls.

FCT portfolio trade mix (Source: FCT)

Key risks 

1)     Business impact from Covid-19. An extended virus scare could negatively impact FCT’s tenants and could potentially lead to negative rental reversions and lower occupancy going forward. This could also negatively impact property valuations and cause P/B to rise in subsequent years. 

2)     Concentration risk. FCT’s top 2 malls, Causeway Point and Northpoint, contribute 75% of its Net Property Income. Any decline in population in the Northern part of Singapore or new malls built in the area could negatively impact footfall in the 2 malls.

3)     Large tenant non-renewals. About 14% of FCT’s total gross rental income is up for renewal in FY20 and non-renewals, especially for anchor tenants, could imply a period of reduced rent even if a replacement tenant is found due to the time required for fitout works. 


Share
Tweet
Pin
Share
No comments
Newer Posts
Older Posts

Popular Posts

  • MSCI Singapore Index rebalancing impact on stocks
  • ARA Logos Logistics Trust: 3 reasons to drive a re-rating of this laggard
  • Why Ascott Residence Trust remains the go-to hospitality gem

Tags

  • Centurion Corp
  • Consumer
  • Covid-19
  • Coworking
  • Eagle Hospitality Trust
  • Gloves
  • Healthcare
  • Index
  • Property
  • REITs
  • Sembcorp
  • SPH REIT
  • Supermarket

Blog Archive

  • ►  2021 (3)
    • ►  6 Jun - 13 Jun (1)
    • ►  21 Feb - 28 Feb (1)
    • ►  24 Jan - 31 Jan (1)
  • ▼  2020 (43)
    • ▼  30 Aug - 6 Sep (1)
      • LCCs vs Full Service Carriers - Uneven recovery pr...
    • ►  23 Aug - 30 Aug (1)
      • 3 key concerns REIT investors should take note of
    • ►  9 Aug - 16 Aug (1)
      • PropNex 151% surge in profits moot as forward guid...
    • ►  2 Aug - 9 Aug (2)
      • 4 key points from Ascendas REIT's 1H20 results bri...
      • 3 takeaways from Frasers Logistics & Commercial Tr...
    • ►  26 Jul - 2 Aug (2)
      • SIA's 1QFY21 results shows a $1bn loss, no end in ...
      • Hospitality pain materializes as Ascott prays on d...
    • ►  19 Jul - 26 Jul (2)
      • Keppel DC REIT vs Mapletree Industrial Trust: Earn...
      • Office REITs: Not quite back to work
    • ►  12 Jul - 19 Jul (2)
      • [Ascott, ARAUSHT, SIAEC] Travel pain coming in
      • ESR-Sabana Merger: Acquisition trial continues
    • ►  28 Jun - 5 Jul (2)
      • 3 things to note from SPHREIT's 3Q business update
      • Strong REITs making moves in tough times (AREIT an...
    • ►  21 Jun - 28 Jun (2)
      • Frasers Centrepoint Trust: More than just a benefi...
    • ►  14 Jun - 21 Jun (2)
    • ►  7 Jun - 14 Jun (2)
    • ►  31 May - 7 Jun (1)
    • ►  24 May - 31 May (3)
    • ►  17 May - 24 May (1)
    • ►  10 May - 17 May (3)
    • ►  3 May - 10 May (2)
    • ►  26 Apr - 3 May (3)
    • ►  19 Apr - 26 Apr (1)
    • ►  12 Apr - 19 Apr (2)
    • ►  5 Apr - 12 Apr (2)
    • ►  29 Mar - 5 Apr (2)
    • ►  22 Mar - 29 Mar (2)
    • ►  15 Mar - 22 Mar (2)

Created with by ThemeXpose